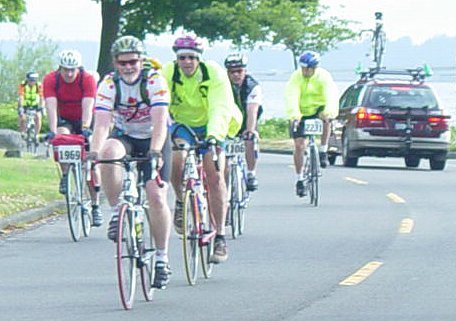
 A nationwide poll for the US Department of Transportation finds that nearly half of all Americans have access to bicycles.
And the more they ride those bikes, the more likely they are to prefer bike lane improvements over bike paths and trails.
The information in the National Survey of Bicyclist and Pedestrian Attitudes and Behavior could be useful to bicycle policy makers who are trying to justify expenditures for bicycle facility improvements in their communities.
Its usefulness is limited, however, by the fact that this information is six years old. The Gallup organization performed the survey in August 2002 for the National Highway Traffic Safety Administration, but the report didn't see the light of day until August 2008.
Six years old
Consider how many more people began riding bicycles in the past couple of years, and the growth of bicycle advocacy activities. How many of you are even riding the same bike that you did in 2002?
The telephone survey involved 9,616 people aged 16 and older and questioned their bicycling behaviors and attitudes in the previous 30 days; so it covers just the summer months, May 11 through August 20, 2002.
I scanned through the summary report and found some interesting findings. Of course, they're like a peek into ancient bicycling behavior. A current survey would be much more useful:
Highlights
— Nearly half (46%) of those over 16 had regular access to a bicycle (higher rates for higher household income);
— Americans made about 2.4 billion bicycle trips made during the summer of 2002;
— One in five trips were for errands (14%) or commuting (5%); the rest were for recreation;
— Among bicyclists, 14% rode 20-31 days during the previous month; those who bicycled 1 to 7 days per month accounted for 59% of all trips;
— The breakdown for where cyclists rode on their most recent trip: paved roads – 48%, sidewalks – 14%, shoulders of paved roads – 13%; unpaved roads – 5%; bicycle lanes on roads – 5%.
— 4% of bicyclists had been injured in the previous two years; about one-quarter was because of a collision with motor vehicles;
— Nearly half (47%) would like to see changes in the way their community is designed for bicycle safety: suburban bicyclists (51%), urban bicyclists (47%), rural bicyclists (42%).
— More bicycle lanes were preferred by all groups, especially those who bicycle most frequently. Bike paths came next, followed by bike trails (see graph).
— 13% felt threatened on their most recent bicycle ride. The causes: motorists — 88%, uneven surfaces — 37%, dogs or other animals — 24%, potential for crime — 17%, congested bike or pedestrian traffic — 10%.
— 20% rode in dark or near-dark conditions in the past 30 days, 63% of that number used reflective clothing, devices or lights to make themselves more visible;
— Half of all bicyclists said they never wore a helmet;
— One in four bicyclists said that when riding in the street, they rode against traffic.
There is a lot more data about bicycling and walking.
An introduction to the report is available at the National Highway Traffic Safety Administration. It comes in three .pdf downloads: Summary Report, Findings Report, and Methods Report.
I just hope if the government undertakes this study in the future, they make an effort to distribute the information in a more timely manner.
First seen at WashCycle

Recent Comments